One thing we’ve always wanted to do is transition the models and visualizations we come up with in our projects into a lasting resource. We have typically left communities with the data we produce and a written report. The challenge has been to share this information to its full potential. The 2D images we produce capture the story we want to tell but we’ve always wanted a way for people to explore the data on their own and ask (and answer) their own questions. Curiosity about data is at the heart of what we do and over the years many other curious individuals have asked about how to explore the data.
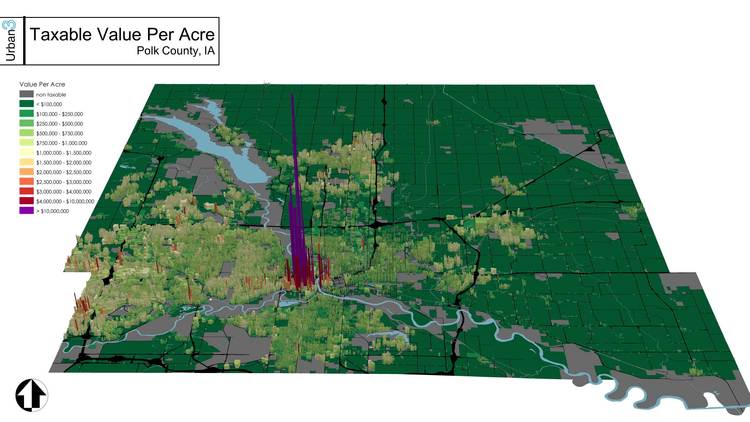
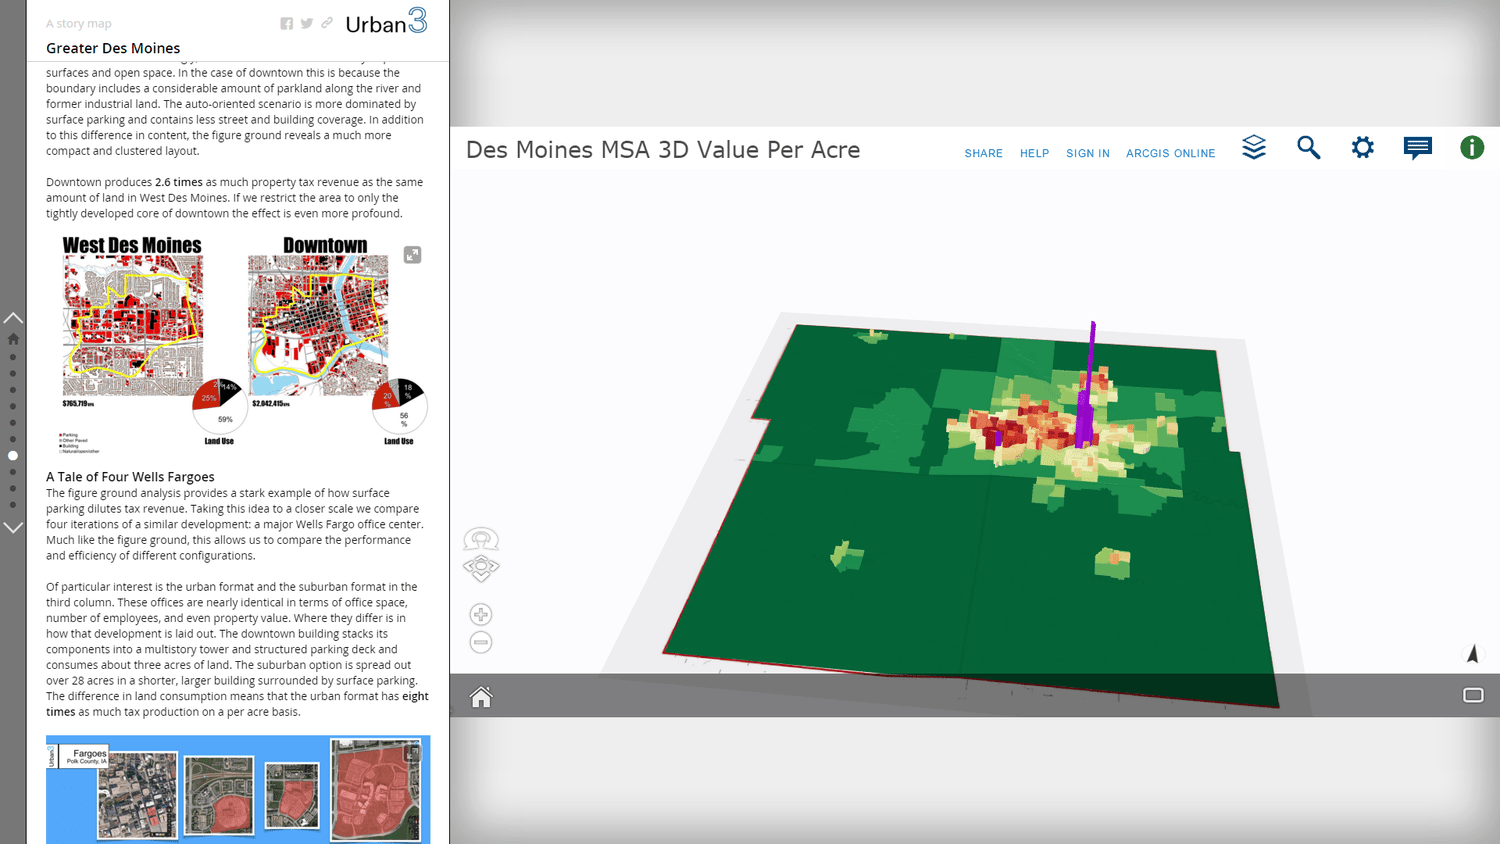
We’re excited to announce that early next year, probably by the end of January, we will be able to offer people exactly that. For our recent project in the Greater Des Moines metro area we decided to experiment with some great tools offered by ESRI. The video below is a screenshot of an upcoming interactive 3D model. The video depicts actual functionality. You will be able to pan, rotate, zoom, and manipulate a 3D model of the Des Moines metro area. You will also be able to click on individual areas to learn more detailed information. Best of all, it doesn’t require any special software or training. You can explore the data from right inside your web browser.
This model is an important component of a wider interactive report on Greater Des Moines. We used another tool provided by ESRI, Story Maps, to compile all of the amazing outputs of our analysis.
Look for more information about the Greater Des Moines project and our Story Map over the next few weeks.