Even before the pandemic, communities struggled to fund the needs of their residents.
At Urban3, we know that city governments feel frustrated every budget season when staff realize they can’t fully support needed services and repairs. We know developers struggle to communicate the overall value of a well-designed development to residents and elected officials. We know that urban designers and planners want to avoid jargon and make the case for density and good design to residents. At Urban3, we believe every community deserves a resilient financial future.
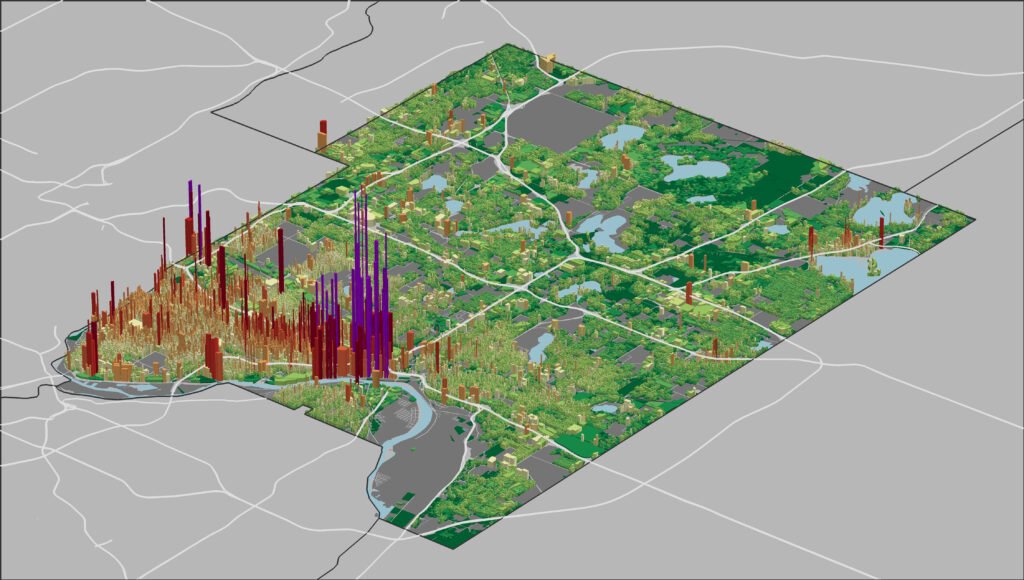
We can model where the most and least fiscally-productive areas in a city are and how those areas compare across development styles and density with our revenue modeling analysis. Urban3 was the first firm to ever visualize a community’s value per acre, and illustrate the impacts of land use on municipal economic health in 3D.
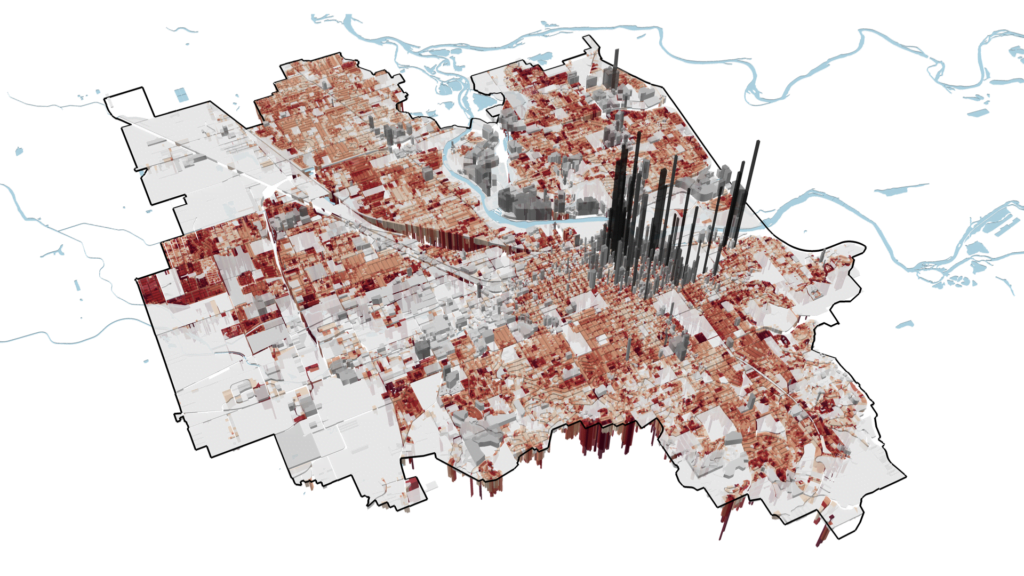
Urban3 can visualize where your community is leaking money or which areas produce more value in revenue than they consume in city services in a Cost of Service analysis. When residents, municipal staff, and elected officials can clearly see your community’s financial health on a map, they will be able to make data-driven decisions together.
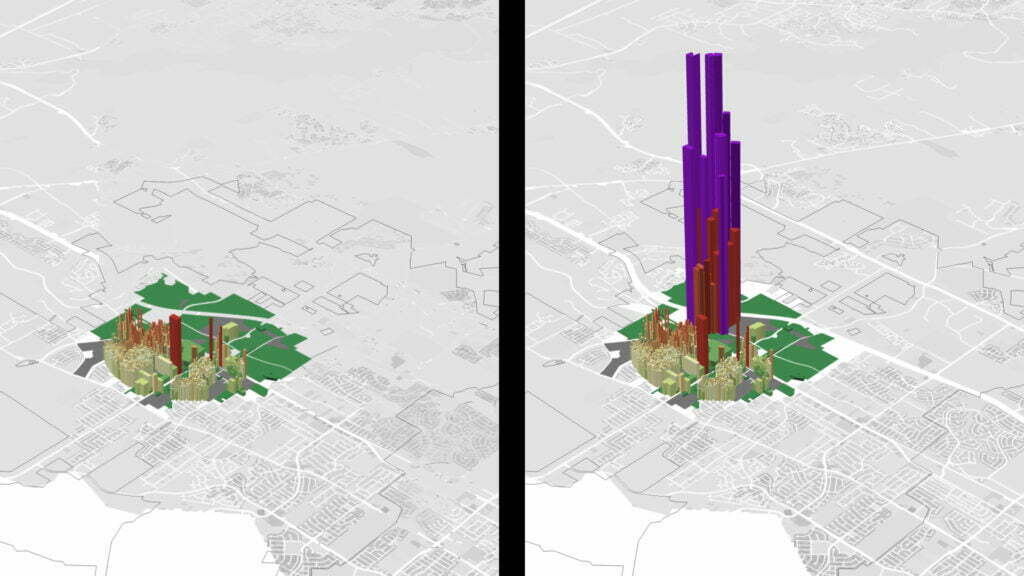
Both cities and developers want to understand the potential value of new development. Through our scenario analysis, clients can quantify and visualize the impact of development scenarios proposed by urban designers or architects, or add an Urban3 scenario analysis to an outside market analysis.
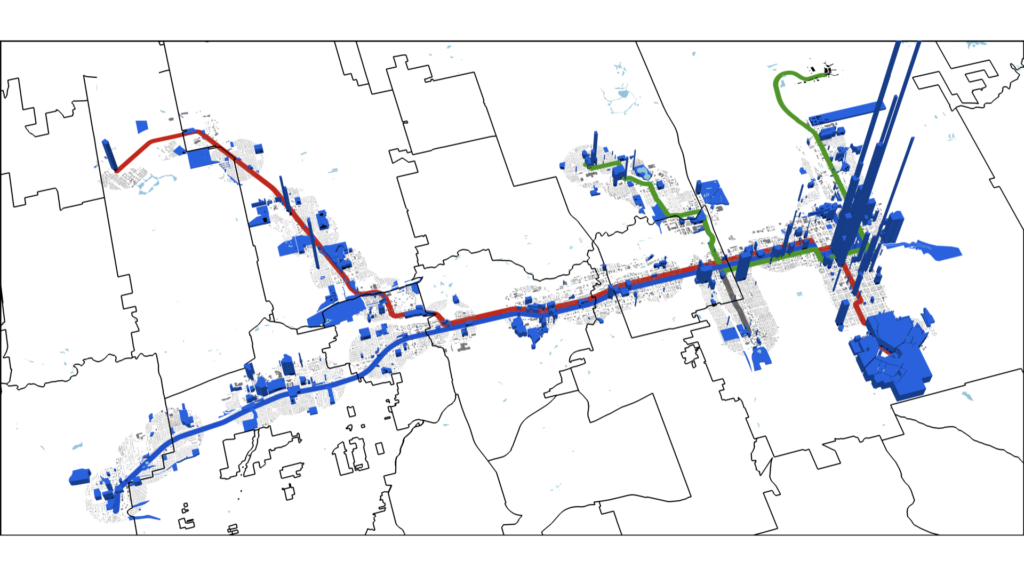
Municipalities often face the double dilemma of a nearly built-out city and a deficit on infrastructure spending. A Public Asset Valuation analysis presents the abundance of publicly-owned land as a potential solution. Based on ideas voiced by Dag Detter, cities and counties can use this analysis to find potential real-world development solutions that increase revenue and ease cost.
Urban3 is made up of tax system experts, and we use our experience to help you innovate. We have conducted analyses in over 160 communities and 35 states in the United States, as well as communities in New Zealand, Canada, and Australia. Our experienced team has examples from your peers across the country, and best practices to share from communities of all scales.
Can a map help you economically? We think so. If you put it on a map, people can understand it. Our 3D visualizations distinguish our approach. Get in touch with us: we’ll share stories and case studies, and see how we can help you.