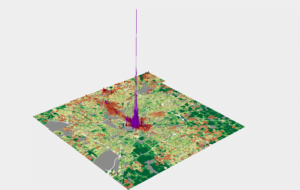
The New Hampshire Housing Finance Authority contracted Urban3 to do a state-wide revenue modeling analysis. Urban3 was able to create a model for the entire state, a first! Fifteen communities that represented a wide variety of development patterns found across New Hampshire were chosen for further analysis. Urban3’s work often finds that even the smallest towns with a main street corridor are incredibly potent, even when compared to larger, heavily developed communities. In New Hampshire, the revenue model showed that both small towns and big cities have lessons to learn from each other.

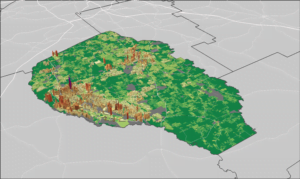
Urban3’s revenue model analysis also highlighted the differences in taxable and nontaxable land in each of the 15 study area communities. This part of the analysis led to discussions on the limitations imposed by nontaxable land and how perceptions of them may or may not accurately reflect reality.

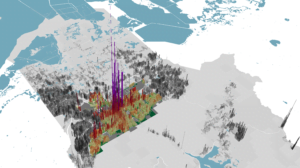
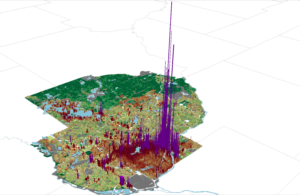
Part of the state-wide analysis included grouping communities into regions and comparing their efficiency and development patterns. This part of Urban3’s analysis demonstrated that for the Seacoast region, patterns of VPA amongst different land uses are increasingly compact and efficient moving from Rochester to Portsmouth, despite similarly sized populations. Both the peak and average VPAs progress in a manner that is consistent with the differences in how each community was developed over time.

Outcomes
- Opened up the conversation on municipal finance to otherwise disconnected groups, like assessing officials, downtown associations, and realtors.
- Small communities without the resources to fund an independent study benefited from the partnerships that made the state-wide fiscal health analysis possible.
- Sparked the creation of a non-profit program that focuses on research, policy change, and outreach.